

Bedarf genau vorhersagen.
Verderb reduzieren.
Retail
Bedarf genau vorhersagen. Verderb reduzieren.
Receive precise forecasts for optimal order quantities and reduced spoilage thanks to artificial intelligence. Increase efficiency and ROI in no time.
The tool for retail practitioners
Forecasting promotional orders
Predict order quantities during promotional periods for greater flexibility.
KPI dashboard
Keep all your forecasts and metrics in view on a clear dashboard.
Assortment planning
Use Circly to better understand and optimize the performance of your products.
Application in retail
Circly in practice.
Maria Höllermann is an independent businesswoman based south of Vienna. Circly has become an integral part of her purchasing process. See how Circly is used in Maria Höllermann's shop directly on the hand scanner and on the BI platform.
Powerful forecasting tool
Implementation drives revenue.
Optimize your retail space turnover with Circly by purchasing according to demand and delisting low-relevance products.Dadurch verbessern Sie nicht nur die Profitabilität Ihrer Regalmeter, sondern erhöhen auch die Lagerdrehung und senken gebundenes Kapital.
Forecasting promotional quantities
Circly in action.
Circly can calculate the impact of promotions based on historical data and predict the article demand for future promotions.
Influencing factors such as weather forecasts, public holidays and economic data are added to the existing data to improve the accuracy of the forecasts.
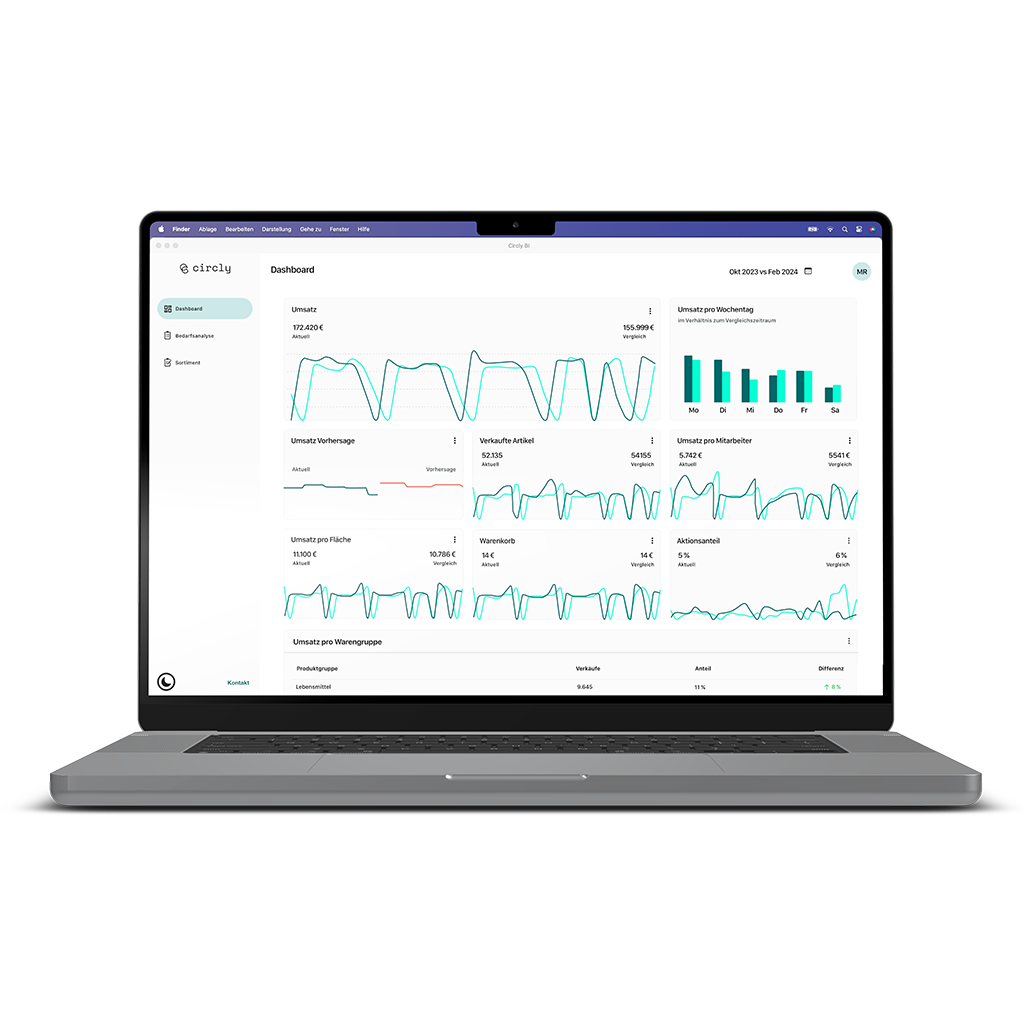
Circly BI Dashboard
Keep your numbers always in view
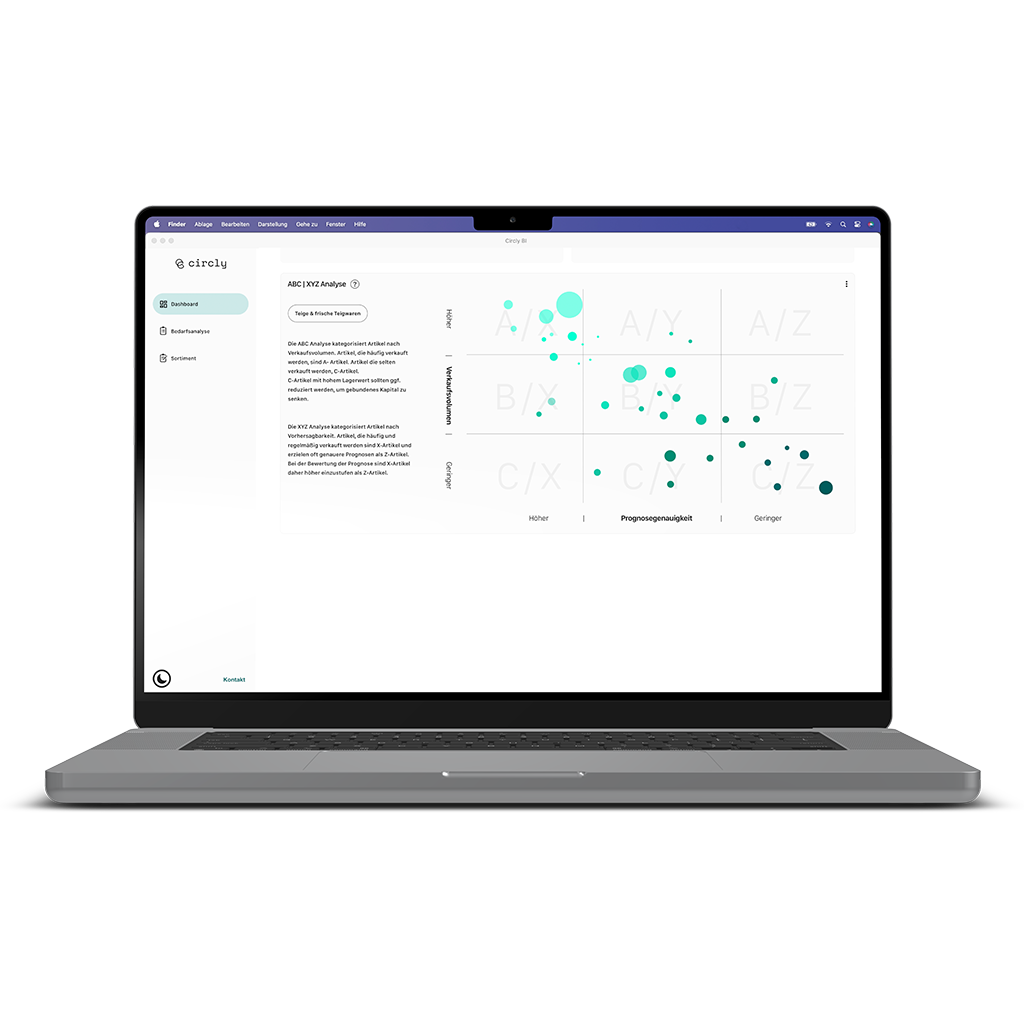
With the innovative Circly dashboard, you have constant access to current metrics such as sales, average basket size, promotion shares or sales per square metre. Our ABC-XYZ analysis classifies your articles according to their demand and predictability.
The ABC analysis for each item helps to better assess the importance of a product, while the XYZ analysis evaluates the predictability of demand.
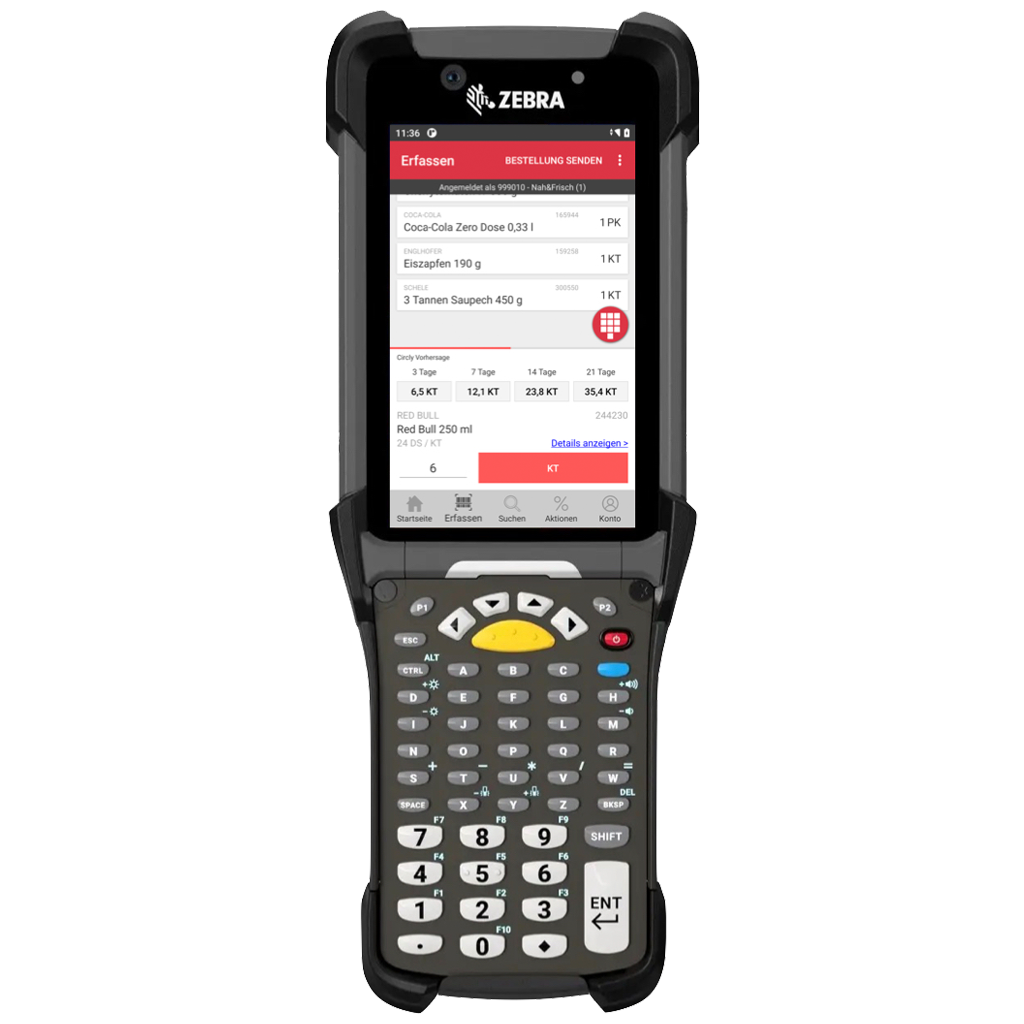
Integration into existing systems
Bestellvorschlag direkt am Handscanner.
Circly supplements existing processes instead of replacing them. A modern API connection offers an alternative to the dashboard. This means that forecasts can be sent to the MDE scanner in the shop, the web shop or the checkout system.
Key figures & forecasts at a glance. Circly BI Dashboard for retailers.
Use the dashboard to keep track of your metrics, generate forecast reports, or visualize sales data. Retailers also have the ability to view metrics from all connected stores.
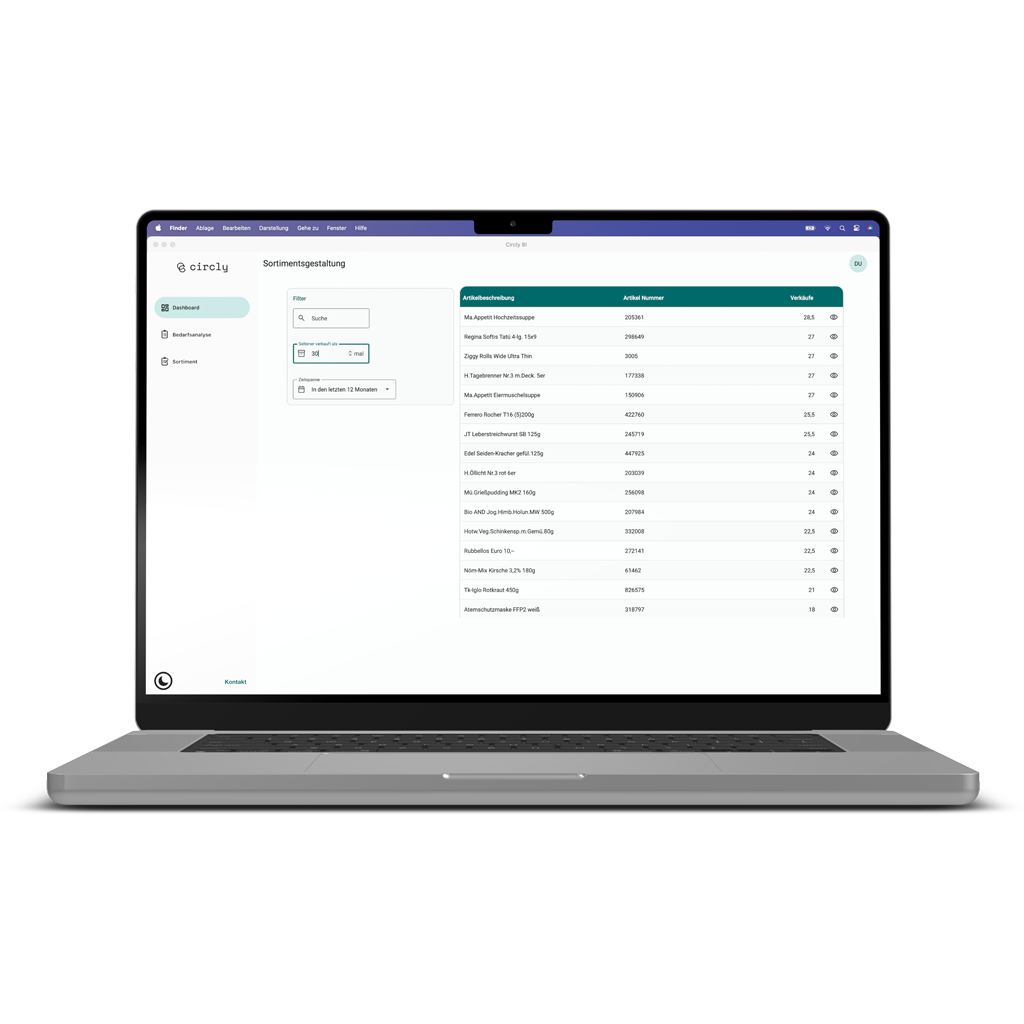
Demand forecasts
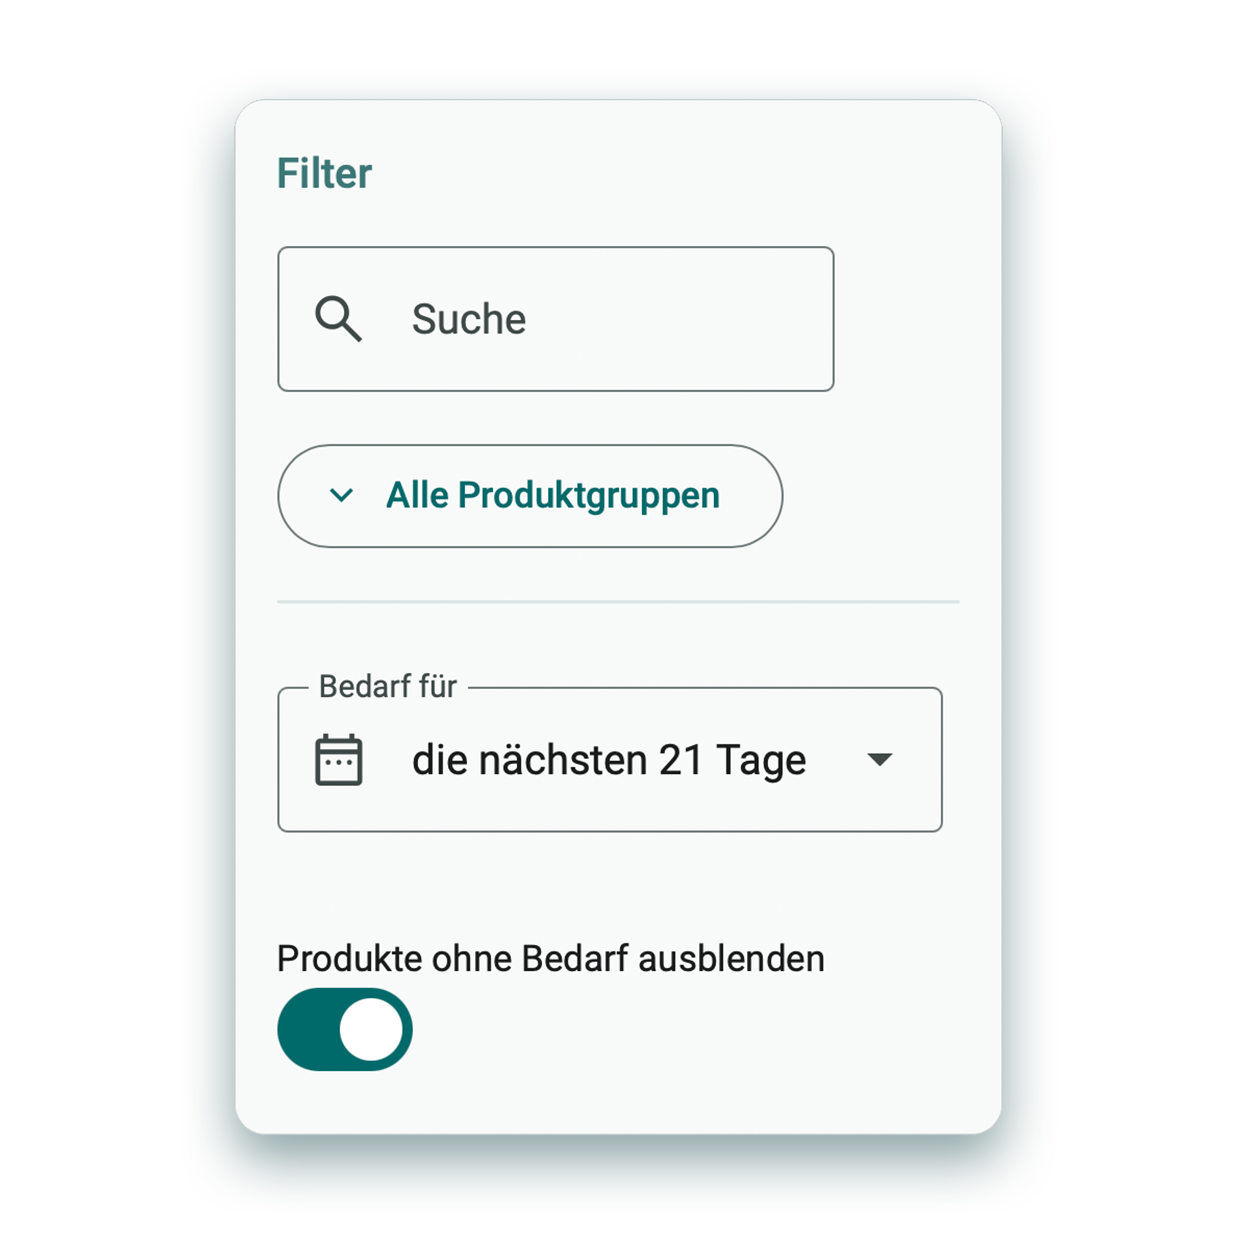
Search & filter your product range
In Circly's demand analysis, you can search through your entire product range. Select the desired item and period for your forecast with just a few clicks.
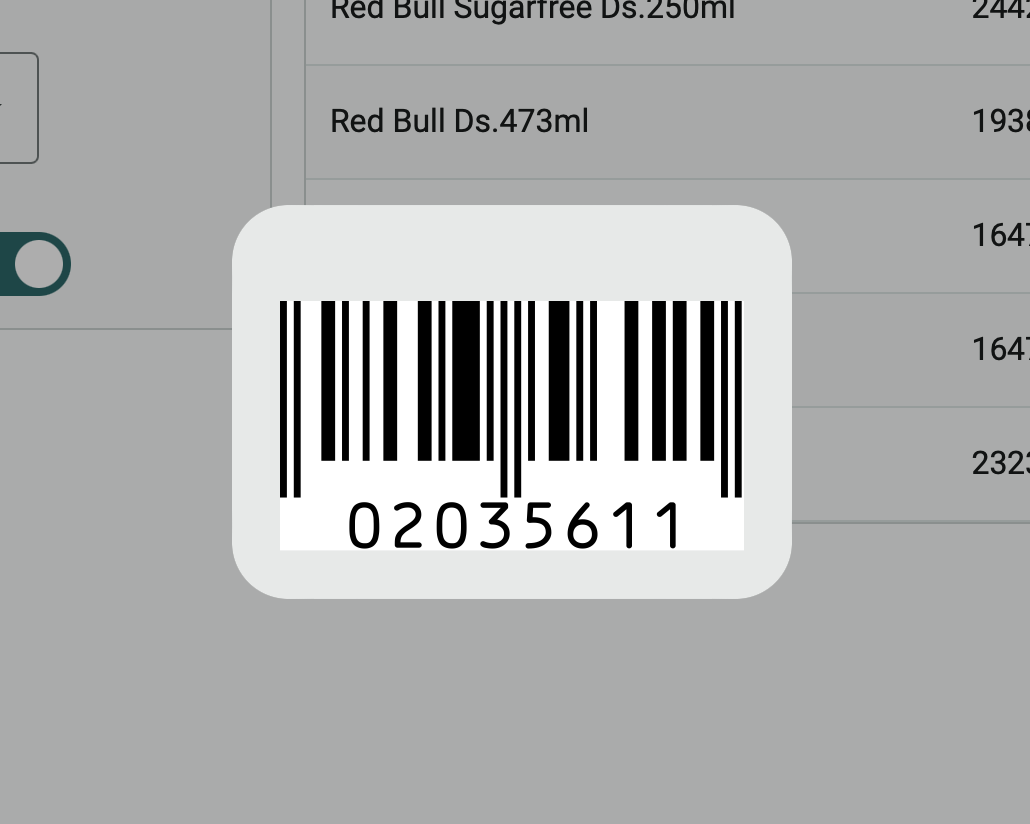
EAN code capture
Display EAN codes of individual items for direct scanning with handheld scanners. This allows for quick and error-free product capture using existing devices.
Dashboard
Graphical representation of relevant metrics
Our innovative dashboard provides retail companies with a clear and up-to-date overview of their key metrics. With real-time updates and user-friendly visualization, it enables quick, informed decisions to optimize your business success.
Set target values directly in the dashboard to maintain an overview of your metrics.
ABC Analysis
Display EAN codes of individual items for direct scanning with handheld scanners. This allows for quick and error-free product capture using existing devices.
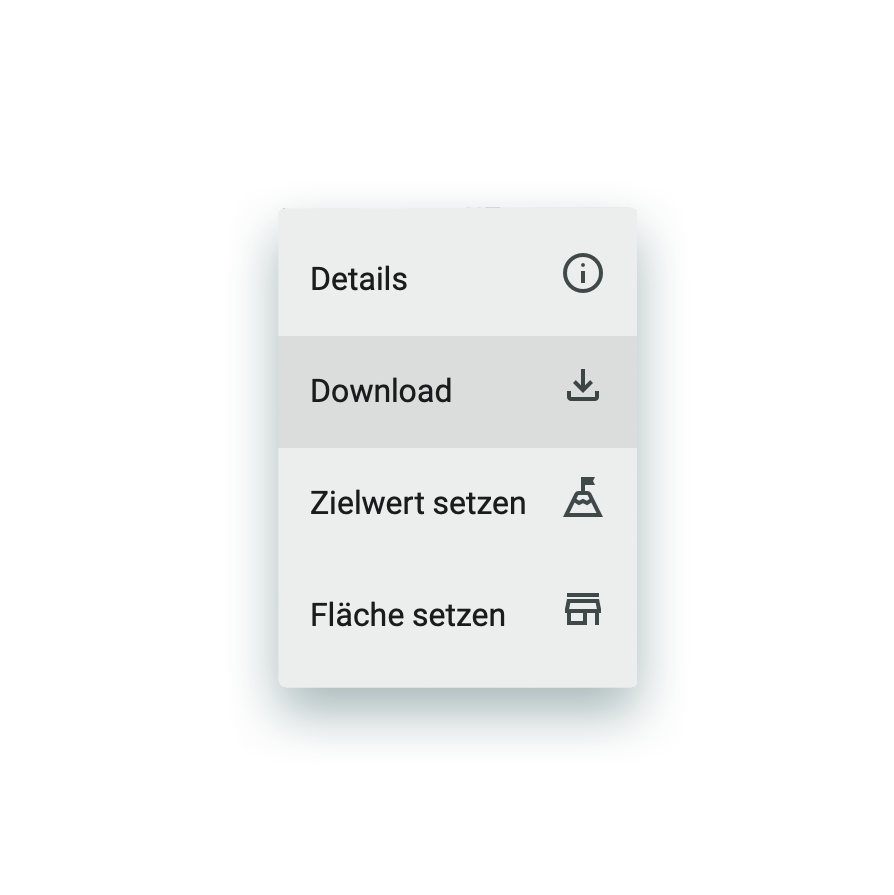
Detail pages for each item
The detail pages of our dashboard provide comprehensive insights for each item, including sales statistics, promotion displays, and ABC analysis. With these in-depth details, you can make precise decisions to increase profitability and optimize your inventory management.
Load Reports
With the dashboard, you can easily download reports and export data in clear table formats. This feature facilitates seamless processing and analysis, supports informed decision-making, and enhances communication of insights within your team.
Assortment planning
Top & Flop
Our dashboard supports your assortment planning by providing detailed sales performance metrics for each item. Easily identify your top-performing and underperforming products, allowing you to optimize your assortment strategically for maximum revenue and customer loyalty.
Industry professionals trust Circly.
I am here for you!
Do you have any questions about using Circly? I'm here to help!
Timo Fenkart | Business Development Specialist
")